Two Way Tables Project
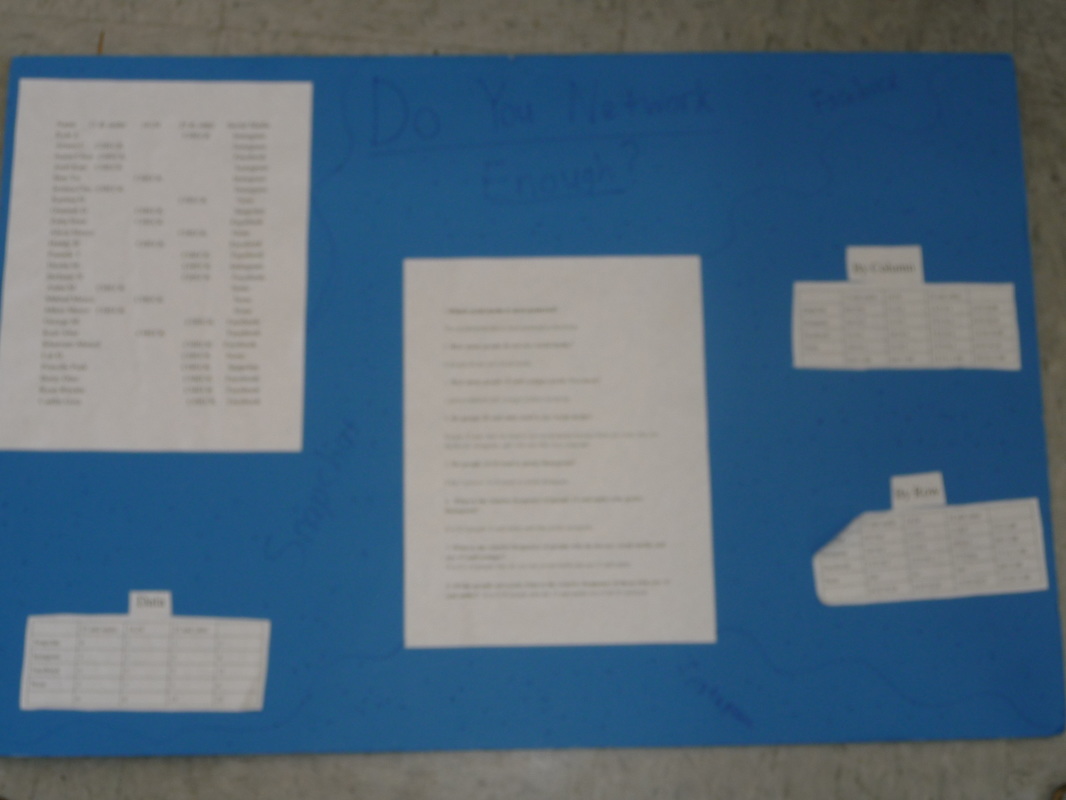
p1. This assignment relates to the standard, 8.SP.4, because in this project, we had to gather data for what social media people prefer the most. We had to use two-way tables and input the data by using relative frequencies by rows and columns( which is calculating the percentages) and by just putting in numbers of people. The two-way tables in this project was organized into age ranges and what social media they prefer. The data gives us a good look on the numbers and percentages, as well as which social media is preferred the most in which or each of the age ranges. Besides knowing which is the most preferred social media, we had to answer some questions on the data itself, like the amount of people in this age range category and this certain social media.
2. Here are the following steps that it took me:
a. I first surveyed the required amount of people for their age and most preferred social media( or none).
b. I filled out the two-way tables based on the data I collected and answered the following questions about the tables.
c. I then planned and wrote the essay part of the project in a piece of paper.
d. After all of that, I used the computer to write and print my essay and organize my data and two-way tables.
e. I then pasted everything onto my poster and added a little creativity on it.
3. This project demonstrates that I was able to put the information on the two-way tables by putting the NUMBERS. This shows that I understand how to organize data into a two-way table( like for instance knowing how many likes Facebook at a certain age range). I also was able to make sure that I kept the data orderly and neat when I collected it for the people I interviewed about their preferred social media and age range. Another thing was being able to write a good essay about the project. Being able to write the essay shows that I can do well in writing for future ELA classes in high school and college.
4. I could have improved on this project by reading my notes on relative frequency by column and row for my project. I should have done this because I had to ask Ms. Diaz for some help in that area of the project. Also, if I didn't ask and checked my notes in the first place, it could teach me to be more reliable. This could really come in good use when I'm in college or just normally in life. Because, in life, you can not rely on everyone for everything. You will have to sometimes go through things by looking it up yourself.
5. I can apply this project to the real world when I do an experiment in my work. I can gather the results in some sort of table for data and compare results for the trials. The data and tables can be resourceful since it will allow me to see the different results. Using the results will then let me to see which one was the right one and if I need to make a few adjustments for the chemicals( for example: how may of the chemicals or if I need something to make the result better or right). Being able to write for this project can also be applied to my work since I will be asked to write reports( just like what I did in my project).
