leaking faucets project
Standards: 7.RP.1 and 7.RP.2a-d
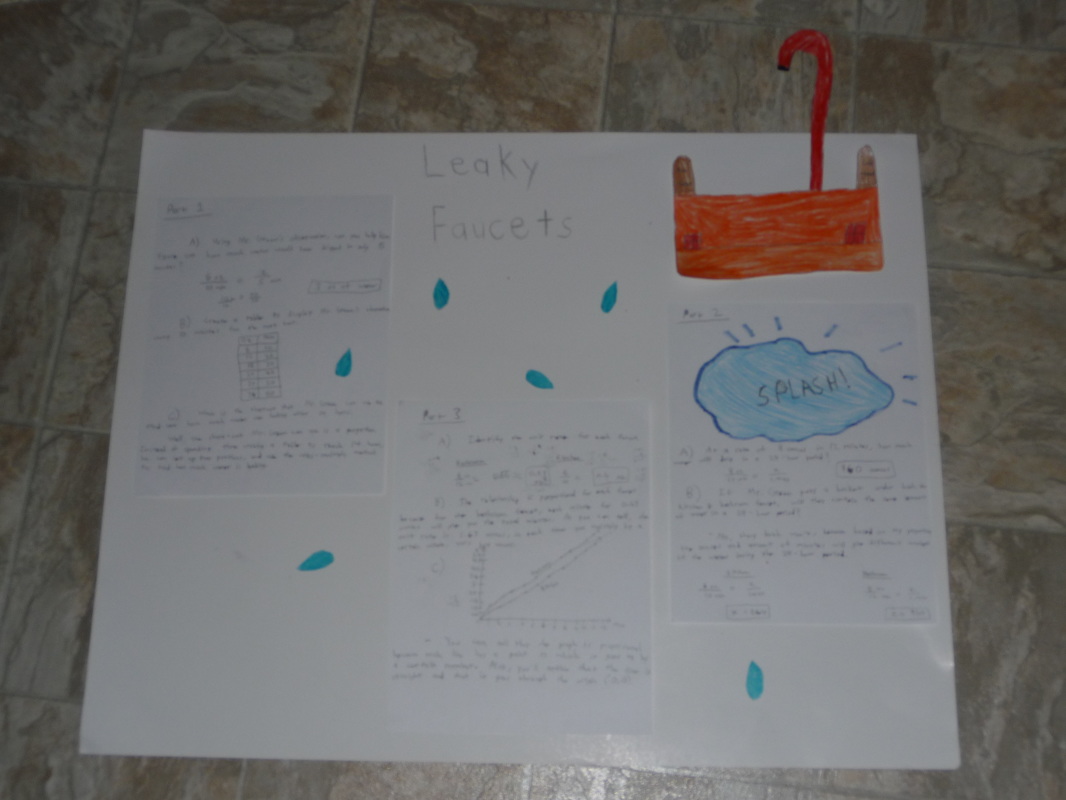
1. This project relates to the standard because it was about writing out proportional relationships for the 2 leaking faucets. We have to try to figure out how many ounces of water there is per minute and if both the kitchen and bathroom faucets leak at the same rate. We had to also set up tables and graphs to figure out if they are proportions or not. Also, this project is about finding unit rates and knowing how to figure out the relationships.
2. Here are the following steps I took:
a. I filled in the performance task that I was given.
b. I got a poster.
c. I drew some pictures and cut them out so that I can paste it on the poster.
d. I then finally wrote everything out on the poster based on the performance task.
3. This project demonstrates that I understand how to use proportions,graphs, and tables. I know how to find the missing value by using proportions. I can also represent a proportional relationship by using graphs. When using graphs and tables, I am able to identify the unit rate, which is the number that tells us how the number goes up by every time.
4. I could have improved on this project by making it much more nice and decorative. Also, I could have spent more time on it to make some better improvements on it. For instance, I could have made the project look 3-D. I could have done something that wasn't that vague and boring. I can should not just use paper to write in all the information and numerals.
5. I can apply this project to the real world when I run the half marathon. In this case, I can use proportions. I can figure out how long, in minutes, it'll take for me to finish one mile. So then, it'll help me stay consistent in my race and it'll help me know how long it'll take me to complete the race in the end. I can also apply my knowledge when I want to figure out how long it takes me to read one page from a book. This will then help me know how long it'll take me to finish the book, based on the amount of pages there are.